Timeline Charts In Project Management
Project management is a versatile sphere with different tools & methodologies.
Managers all over the world try to use innovative techniques and new trends to improve their business results. However, there is at least one component that appears in every project. There are some basic and interesting facts about project timelines charts.
What is a Project Timelines Charts?
Timelines are extremely important in project management because they help to visualize time-related metrics, synchronize tasks, set deadlines and define potential delays. The diagrams are useful for managers. Timelines will help you to visualize three main timeframes: planned time, actual time in-progress and forecasted time.
Usually, managers use project timeline charts for:
- Projects and tasks planning
- Road mapping
- Portfolio management
Timeline Diagram Components
The diagram structure depends on the tasks description. Timelines may be highly detailed or simple. One should pay attention to:
- The set of tasks and objectives to be completed;
- All dates and deadlines;
- Dependencies between objectives;
- Expected duration of tasks.
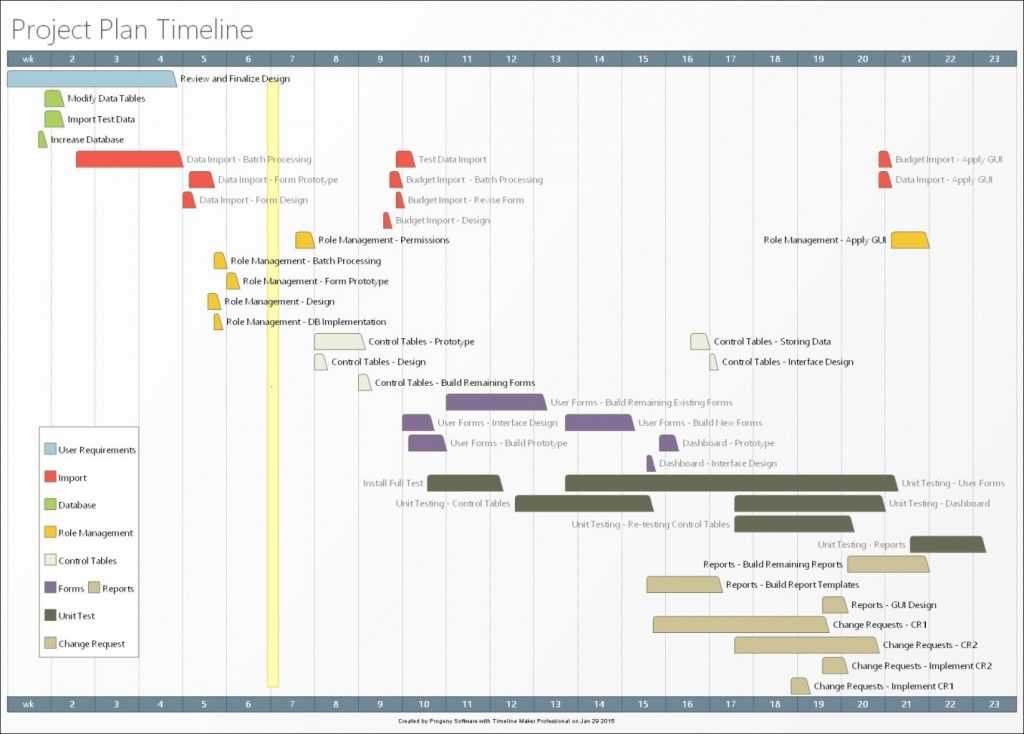
Actually, timelines can take many forms, but the most popular and powerful option is Gantt chart.
Gantt Chart includes horizontal bars, which represent the duration of tasks. It really provides an easy visual depiction of the project.

What are the purposes of project timelines charts?
Timeline charts are good for projects involving many people. It does not demand a lot of time or efforts to make a chart and keep it.
5 Gantt Charts Benefits
- As Gantt charts keep users on track and provide a visual timeline for starting and finishing tasks, they really help to avoid project’s completion confusion.
- If you manage a complex task, Gantt project plan diagrams eliminate misunderstandings and keep everyone on the page.
- The diagrams help to clarify task relationships and get the best workflow and overall success.
- Users can clearly understand where resources need to be allocated or shared.
- The charts help decision makers to look ahead to ensure each given project is working toward the achievement of the company’s strategic goals.
How to make project timelines charts?
Today managers have possibilities to use any specialized project management software to create and manage their tasks with the help of charts and diagrams.
The majority of the charts are based on WBS (Work Breakdown Structure) that clearly defines all task requirements.
Want to find a useful tool to create your charts?
Microsoft Excel proposes a scatter chart.
You can format it and create a timeline diagram.
Gather the key events and critical deliverables of your project. These milestones will be used for a timeline. Then you will need to add the column with some plotting numbers.
Gantt Chart view with PowerPoint
Microsoft PowerPoint produces simple charts and timelines.
Project management solutions like GanttPRO allow managers to create Gantt charts and use them to refine the schedule in real time.
If you need to import Excel Gantt diagram in GanttPRO, you should apply the following steps: Click the plus button (+) at the top left of the dashboard and add an XLSX or CSV file.
Then click the import button and move your file.